IRB Infrastructure has entered a strong momentum phase after witnessing a sharp breakout on the hourly chart. The latest structure reflects aggressive buying participation as the stock moved decisively above its recent consolidation range and reclaimed all major moving averages with strong momentum candles. The current move becomes technically important because IRB had spent several sessions trading inside a weak sideways structure near the 20–22 zone. However, the latest breakout candles completely changed short-term sentiment as buyers pushed the stock sharply higher with visible momentum expansion.
IRB Share Price Target Outlook
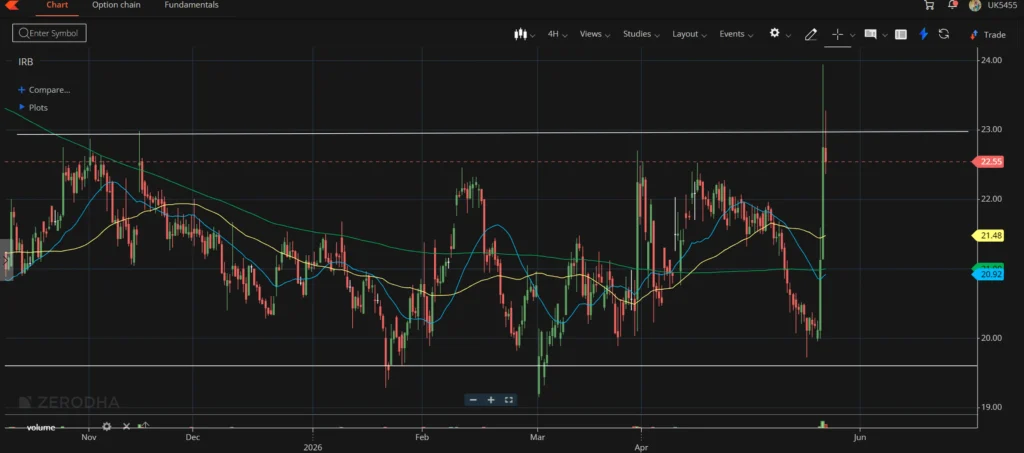
The hourly chart clearly shows how IRB shifted from a weak range-bound structure into a momentum breakout phase. Earlier price action remained compressed near lower support levels while short-term moving averages stayed flat. This usually reflects uncertainty and lack of directional momentum. However, the latest candles completely changed that structure. Buyers entered aggressively near the 20 zone and triggered a strong upside move that pushed price above the blue 21 SMA, yellow 50 SMA and green 200 SMA within a short period.
One major technical improvement visible on the chart is the bullish crossover between short-term moving averages. The 21 SMA has now crossed above the 50 SMA, while price itself has moved sharply away from all moving averages. This usually reflects strengthening bullish momentum after a breakout phase. Another important observation is volume behavior. The breakout candle near the 22.5 region showed strong volume participation, confirming that the latest move is backed by active buying interest rather than weak low-volume movement.
IRB Share Price Target Tomorrow
For tomorrow’s session, IRB may continue attracting momentum buying if the stock sustains above the 22.55 breakout zone during the opening phase of trade. In that scenario, the immediate upside targets visible on the chart remain near 23 and later 23.25. If momentum remains strong with continued volume participation, the stock may gradually attempt movement toward the broader 24 resistance zone as well.
At the same time, traders may closely monitor whether price maintains stability above the breakout level because failure to sustain above 22.55 can temporarily slow momentum and trigger short-term profit booking. The immediate structure currently favors bullish continuation as long as the breakout zone remains protected.
Price Action Near Key Resistance Levels
The 22.55 region now becomes the immediate breakout support zone because the stock has already crossed this level successfully. If IRB sustains above this area, momentum may continue improving during upcoming sessions. The next important upside zone visible on the chart remains near 23 followed by the broader 23.25 resistance area marked on the chart. These levels become immediate upside targets because they remain untested after the latest breakout move.
Above this zone, the broader intraday swing resistance remains near 24, which may become an important momentum zone if buying pressure continues. On the downside, immediate support remains positioned near the 21.47 region where the 200 SMA is currently aligned. The blue 21 SMA near 21.17 and yellow 50 SMA near 20.69 continue acting as broader support zones below current price action. The current structure therefore reflects active bullish momentum with breakout continuation potential.
IRB Swing Trading Targets
From a broader swing trading perspective, the latest breakout structure has improved IRB’s technical outlook considerably. If the stock successfully sustains above the current resistance cluster during upcoming sessions, the next swing trading zone may gradually shift toward 25.5. Beyond that, the broader swing target visible from the larger recovery structure remains near 27, especially if momentum continues strengthening alongside improving market sentiment.
For long-term discussions around IRB share price target 2027, IRB share price target 2028 or even IRB share price target 2030, the stock may require sustained business growth, infrastructure expansion and continuation of broader bullish market participation. However, the current chart structure has clearly improved compared to the earlier consolidation phase.
Buy On Dip And Breakout Opportunity
The latest setup suggests that buy-on-dip interest may emerge near the 21.50–21.20 support cluster because this region aligns closely with reclaimed moving averages and the breakout structure. If price revisits this zone with stable candles and reduced selling pressure, traders may monitor whether buyers continue defending momentum.
A stronger breakout continuation setup may develop if IRB sustains above the 22.55 region with continued momentum candles and healthy volume participation. Such a move may gradually strengthen bullish sentiment toward higher intraday and swing resistance zones.
The current structure therefore supports momentum-based bullish continuation rather than defensive consolidation behavior.
IRB Share Price Outlook
IRB share price outlook has improved significantly after the latest breakout because the stock reclaimed all major moving averages while also generating strong momentum expansion on the hourly chart. The structure now reflects active bullish participation instead of weak sideways consolidation. The next few sessions may therefore become important for determining whether the stock can sustain above breakout support and continue building momentum toward higher resistance zones.
Technical analysis works on probability and not certainty. Market sentiment, infrastructure-sector developments, broader index movement and institutional activity can influence IRB share price movement at any time.
Bottom Line
IRB Infrastructure has shifted into a bullish momentum structure after breaking out strongly from its earlier consolidation range. The stock now trades above all key moving averages with improving volume participation, which strengthens short-term technical sentiment considerably. As long as IRB sustains above the 22.55 breakout zone, the structure may continue favoring upside momentum toward higher resistance levels during upcoming sessions.
You can also explore our latest market analysis articles covering Nifty target tomorrow, Infosys stock forecast, Cochin Shipyard technical outlook and Bharti Airtel share target analysis, where we discussed breakout structures, moving average behavior, swing trading setups and support-resistance zones across different sectors. Comparing IRB Infrastructure’s latest breakout momentum with these stocks may help traders understand how broader market sentiment and sector rotation are influencing current trading opportunities.
Frequently Asked Questions
What is the immediate target for IRB share price tomorrow?
The immediate upside targets visible on the hourly chart remain near 23 and 23.25.
Why is IRB stock looking bullish now?
The stock reclaimed all major moving averages with strong breakout candles and improving volume participation.
What are the major support levels for IRB?
The important support zones remain near 21.47, 21.17 and the broader 20.69 region.
What are the swing trading targets for IRB?
If momentum sustains, the broader swing trading zones remain near 25.5 followed by 27.
Why is the 22.55 level important now?
The stock already broke above this region, making it the key breakout support zone for short-term momentum continuation.