
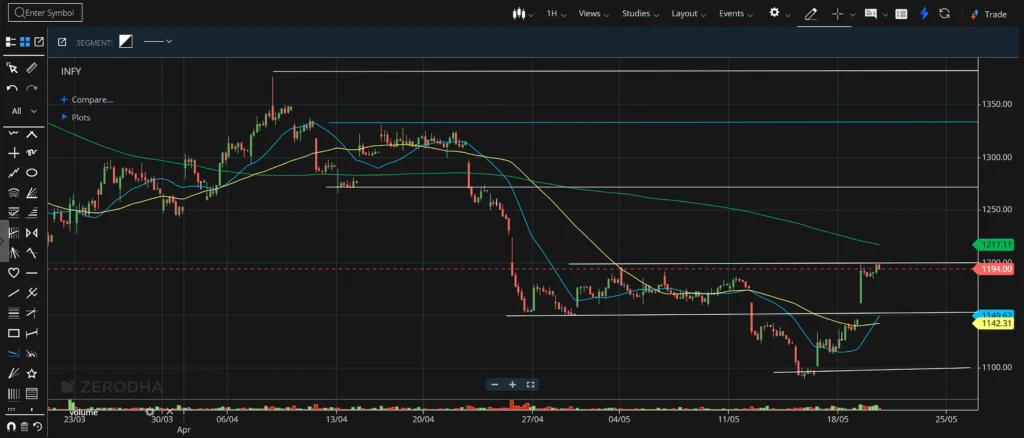
Infosys stock has shown a strong rebound after facing heavy selling pressure during the previous correction phase. The latest 1-hour chart reflects improving short-term momentum as buyers pushed the stock sharply higher from the 1090 support region and reclaimed important moving averages within a short period.
The recovery becomes technically important because Infosys had remained under pressure for several weeks after failing to sustain above the broader 1300 region earlier. During the decline, the stock continuously traded below key moving averages and formed lower highs, which weakened overall sentiment across the IT sector. However, the latest structure now suggests that the correction phase may be slowing as buyers gradually regain control near lower levels. For traders tracking Infosys stock target or Infosys stock forecast, the next few sessions may become important because the stock is now testing a major breakout zone near 1195.
Infosys Stock Target – Why Its Rising?
One major reason behind the recent recovery in Infosys stock is the broader rebound across Indian IT stocks after a sharp valuation correction. Reports suggest that IT stocks including Infosys, TCS and Tech Mahindra attracted fresh buying interest as sector valuations dropped near levels last seen during the 2008 financial crisis.
Another important trigger came from currency movement. Recent weakness in the Indian rupee improved sentiment around export-focused IT companies because a weaker rupee generally benefits revenue realization for software exporters. This helped the Nifty IT index outperform the broader market during recent sessions.
Infosys also witnessed stronger market participation after investors started focusing on the company’s improving deal pipeline, AI partnerships and better long-term demand visibility. Market reports highlighted that the company’s management remained positive on future deal wins and AI-led business opportunities. The latest rally therefore appears driven by a combination of valuation comfort, sector recovery and improving sentiment around long-term technology spending.
Price Action Near Key Resistance Zones
The 1195 region is currently acting as the immediate resistance and breakout zone because the latest rally has already tested this level. A sustained move above this area may improve short-term momentum further and shift focus toward the 1215–1220 region where the 200 SMA is positioned.
The broader resistance zone marked near 1270 on the chart becomes the next important swing target if the stock successfully reclaims the 200 SMA with strong momentum.
On the downside, immediate support remains near the 1140–1150 region where both the 21 SMA and 50 SMA are currently aligned. Below that, the 1100 zone remains the major swing support area visible on the chart.
The current setup therefore reflects improving strength, but confirmation near resistance remains critical before a larger trend reversal can develop.
Immediate Targets And Swing Trading Targets
For immediate short-term movement, Infosys may continue attracting buying interest if the stock sustains above the 1150 support region. In that scenario, traders may monitor whether price successfully breaks and sustains above the 1195 resistance zone. If breakout confirmation emerges above 1195, the next immediate upside zone may shift toward 1215–1220 near the 200 SMA.
From a broader swing trading perspective, the chart structure may improve significantly only if Infosys sustains above the 200 SMA resistance cluster. In that case, the next swing trading target visible on the chart remains near the 1270 resistance region, followed by the higher positional zone near 1350. However, failure to sustain above immediate support can slow recovery momentum and trigger temporary consolidation again.
Buy On Dip And Breakout Opportunity
The current setup suggests that buy-on-dip interest may emerge near the 1140–1150 support cluster because this region aligns closely with short-term moving averages. If price revisits this zone with stable candles and reduced selling pressure, traders may monitor whether buyers defend the structure again.
A stronger breakout opportunity may develop only if Infosys sustains above the 1195 resistance zone with improving momentum candles. Such a move could strengthen short-term sentiment and gradually increase bullish participation toward the 200 SMA and higher swing resistance levels. The structure currently supports cautious optimism rather than aggressive directional assumptions.
Bottom Line
Infosys stock has shown strong recovery momentum after rebounding sharply from lower levels and reclaiming short-term moving averages. The latest structure reflects improving sentiment across the IT sector, but the stock is now approaching an important decision zone near 1195 and the 200 SMA resistance cluster.
A sustained breakout above these levels may gradually strengthen the broader recovery structure toward higher swing resistance zones in the coming sessions.
Frequently Asked Questions
Why is Infosys stock rising recently?
Infosys and other IT stocks attracted fresh buying interest after sharp valuation corrections, improving rupee-related export sentiment and positive outlook around AI partnerships and future deal wins.
What is the important resistance zone for Infosys stock now?
The immediate resistance remains near 1195, while the broader resistance cluster is visible near 1215–1220 around the 200 SMA.
What are the major support levels for Infosys share?
The key short-term support region is currently visible near 1140–1150, followed by the broader 1100 swing support zone.
What are the swing trading targets for Infosys?
If the stock sustains above the 200 SMA resistance region, the next swing trading target visible on the chart is near 1270 followed by the broader 1350 zone.
Can Infosys continue recovery momentum from current levels?
Momentum may continue improving if the stock successfully breaks higher resistance zones and sustains above major moving averages.
Pingback: IRB Share Price Targets – IRB Share Price Target Tomorrow, 2026 & Swing Targets -