Bharti Airtel witnessed a strong rebound in the latest trading sessions after spending several weeks under selling pressure. The chart structure now shows signs of improving short-term momentum as buyers managed to regain control from lower levels and pushed the stock sharply higher within a short period. The recent move becomes important because the stock had remained trapped in a broader weak structure for quite some time. Lower highs and repeated selling near resistance had kept momentum on the bearish side earlier, but the latest recovery candles suggest that sentiment has started improving gradually. The market will now closely watch whether this rebound can sustain further or if the stock again faces resistance pressure near higher zones.
Bharti Airtel Price Target Tomorrow
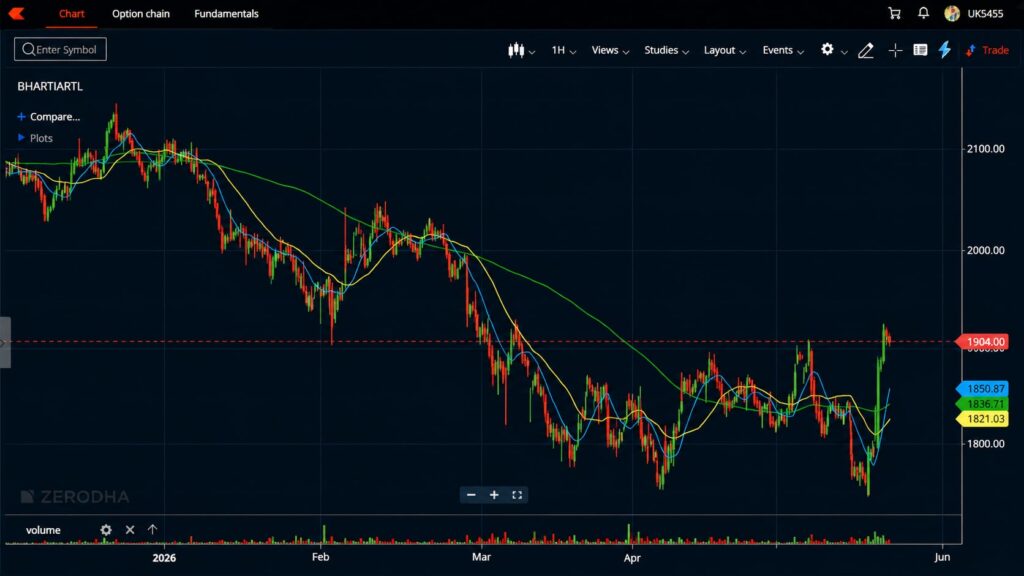
The latest chart reflects a clear shift in short-term behavior. After falling toward the 1750 area, the stock witnessed aggressive buying activity that quickly changed the tone of the structure. Instead of slow recovery candles, the rebound happened with strong directional movement, which usually indicates active participation from short-term buyers.
Another important change visible on the chart is the recovery above major moving averages. During the earlier decline, price had consistently traded below these indicators, reflecting weakness across multiple sessions. The latest move has now pushed the stock back above the short-term and medium-term averages, improving technical sentiment considerably.
At the same time, the recovery has approached an important resistance zone near 1900 where the latest candles have started slowing down slightly. This suggests that traders are becoming more cautious after the sharp upside move rather than chasing momentum aggressively at higher levels.
Price Action Near Moving Averages
The blue 21 SMA has now started curving upward near the 1850 zone, while the yellow 50 SMA remains positioned close to 1821. The green 200 SMA is also placed in the same broader region, creating a strong technical support cluster below current price action. This alignment becomes important because moving average clusters often act as support during recovery phases. As long as the stock continues holding above this region, the structure may continue favoring short-term strength.
The broader picture now looks considerably stronger compared to previous sessions because price has reclaimed all three major moving averages together. However, sustainability remains the key factor. Strong recoveries often face temporary consolidation after a sharp move, especially near resistance zones where traders may prefer partial profit booking.
Support And Resistance Structure
The immediate resistance area remains positioned near 1905–1915. A clean move above this region could improve momentum further and gradually open space toward the 1940 area. On the downside, the first important support zone remains near 1850. Below that, the broader moving average cluster around 1835–1820 may become an important defensive region for buyers. The current structure therefore reflects a market that has improved significantly in the short term but still requires confirmation near resistance before a stronger continuation move develops.
Buy On Dip And Breakout Opportunity
The recent recovery has created two possible technical scenarios for traders monitoring the stock closely. The first is a buy-on-dip structure near the 1850–1835 support zone where moving averages are currently aligned. If price revisits this region with stable candles and reduced selling pressure, the area may attract fresh buying interest again. The second setup is a breakout continuation opportunity above the 1915 resistance area. If the stock manages to sustain above this zone with strong candles, momentum may improve further as traders look for confirmation of a broader trend reversal. Both scenarios depend heavily on price behavior near support and resistance rather than aggressive directional assumptions.
Tomorrow’s Trading Outlook
The latest structure suggests that short-term sentiment has improved noticeably after the recent reversal from lower levels. Buyers currently have an advantage because the stock reclaimed important technical levels quickly after the decline. However, the next session may still remain highly dependent on how price behaves near resistance. If momentum continues building above support, the recovery structure may extend further. On the other hand, hesitation near upper zones can lead to temporary consolidation before the next directional move develops.
Technical analysis works on probability and not certainty. Market conditions, sector sentiment, institutional activity and broader volatility can influence price movement at any time.
Bottom Line
The current chart structure reflects improving momentum after a prolonged weak phase, but the stock is now approaching an important decision zone near resistance. The recovery remains technically positive as long as price sustains above the moving average cluster, while a breakout above the recent resistance area may further strengthen short-term sentiment.
Frequently Asked Questions
What is the important resistance level for Bharti Airtel tomorrow?
The 1905–1915 zone remains the immediate resistance area on the current chart structure.
What are the key support levels visible on the chart?
The important support region is currently visible near 1850 followed by the broader 1835–1820 zone.
Why did the stock recover sharply from lower levels?
The chart showed aggressive buying interest after prolonged weakness, which triggered a strong reversal move from oversold levels.
Is the current recovery technically strong?
The structure improved after price reclaimed the 21 SMA, 50 SMA and 200 SMA together, which strengthened short-term momentum.
What can confirm stronger upside continuation?
A sustained move above the recent resistance zone with strong candle confirmation may improve bullish momentum further.