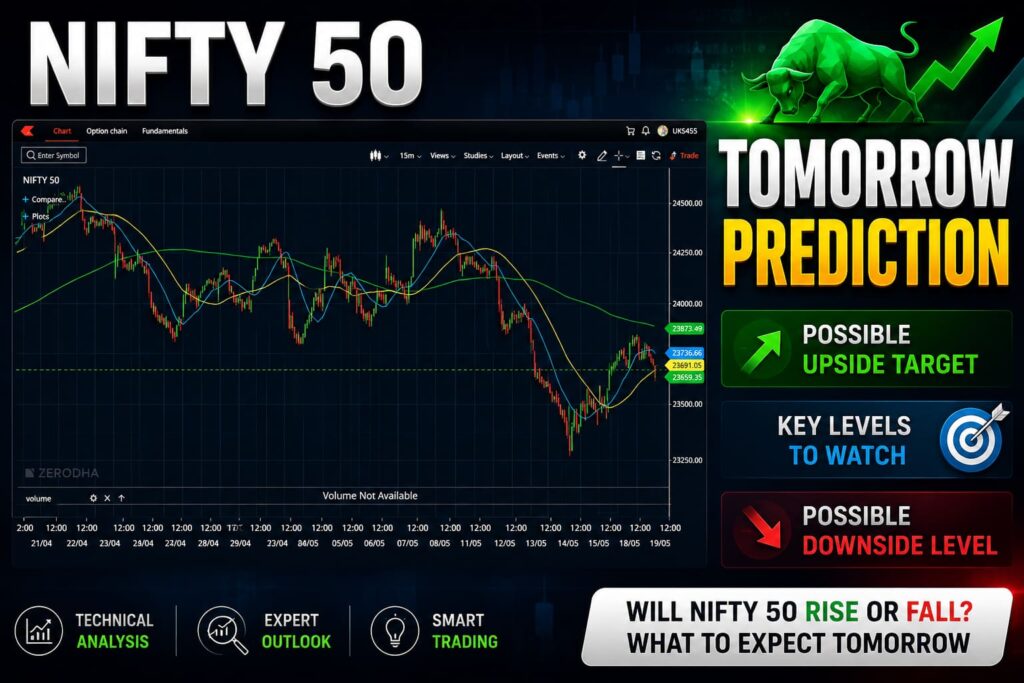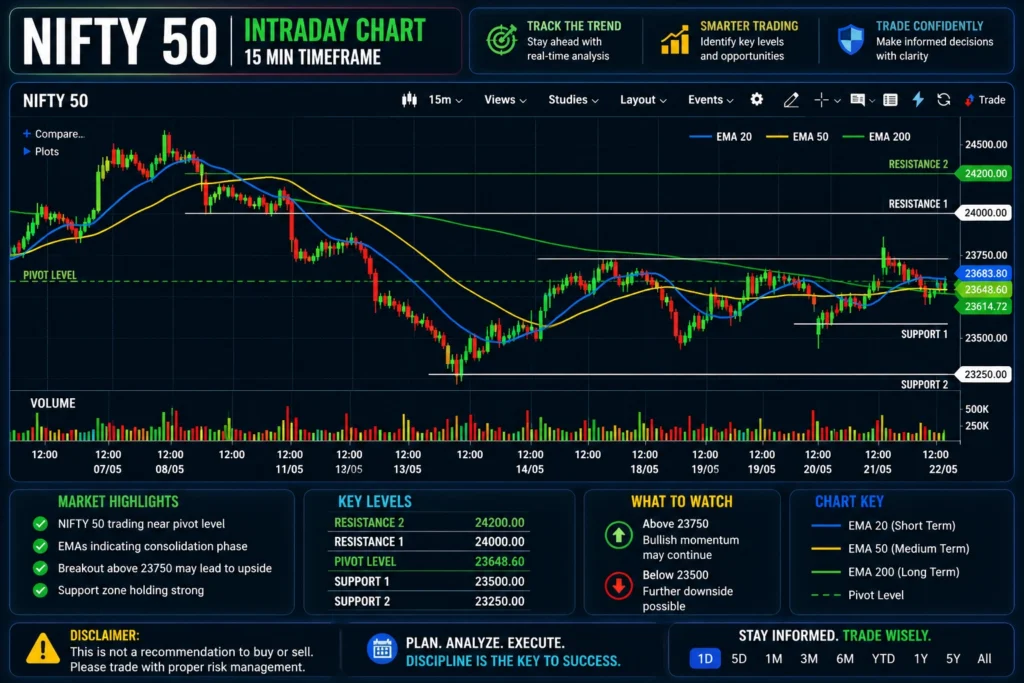
Nifty continued trading in a volatile range during the latest session as the index struggled to maintain momentum near important short-term moving averages. The 15-minute chart shows that the market attempted a recovery after the recent decline toward lower levels near 23250, but upside continuation remained limited as selling pressure returned near resistance zones. The current structure reflects a market that is trying to stabilize after a sharp correction phase but still lacks strong bullish confirmation. Buyers managed to defend lower levels effectively during the recent rebound, although the latest candles indicate hesitation once the index approached higher resistance areas again.
For traders tracking Nifty target tomorrow, Nifty target today or Nifty target for Monday, the present setup suggests that the next session may largely depend on whether the market can reclaim short-term momentum above moving averages.
Nifty Today
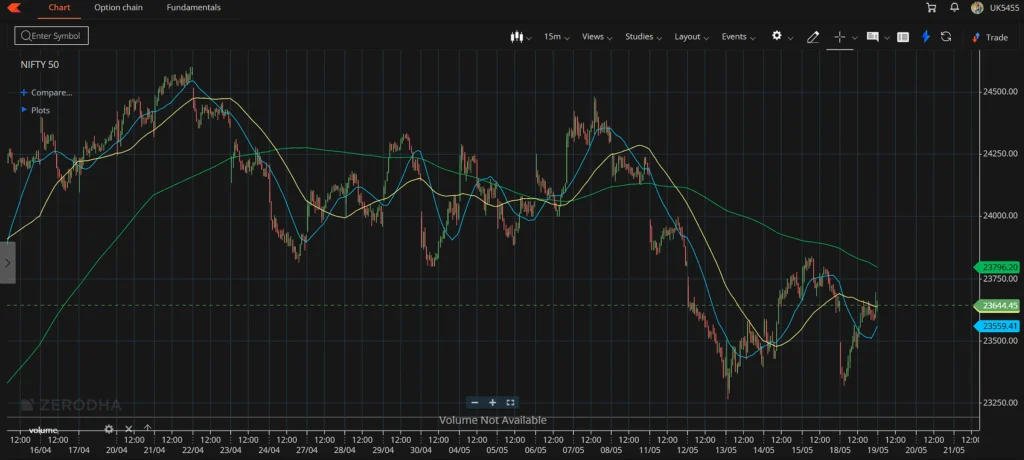
The latest price action highlights a gradual shift from panic selling toward consolidation. Earlier weakness pushed the index sharply lower during the recent sessions, but the recovery from lower levels helped Nifty regain stability near the 23500 zone.
One important observation from the chart is the repeated reaction near the blue 21 SMA and yellow 50 SMA. During the latest rebound, the index attempted to reclaim both moving averages, but the candles started weakening again before a strong breakout structure could develop. This usually suggests that traders are still cautious near higher levels and aggressive buying participation remains limited.
The green 200 SMA continues acting as the broader trend barrier near the 23790 region. The market has repeatedly struggled to sustain above this zone during recent sessions, which keeps the larger short-term structure slightly defensive despite recovery attempts.
At the same time, the market is no longer showing aggressive lower-level breakdown candles like previous sessions. This reflects improving stability compared to the earlier correction phase.
Nifty Target Tomorrow – Moving Averages
The blue 21 SMA is currently placed near 23559, while the yellow 50 SMA remains positioned around 23644. Nifty is trading close to this moving average cluster, making it an important short-term decision zone for the next session. If the index manages to sustain above these levels with stronger candles, momentum may gradually improve toward the 23750–23800 region. However, failure to maintain strength above short-term averages may again attract selling pressure and pull the market toward lower support levels. The current structure therefore reflects a market balancing between recovery and resistance rather than showing a confirmed directional trend.
Support And Resistance Structure
Immediate support remains visible near the 23500–23480 zone. If this area fails to hold, the market may again drift toward 23350 and lower support regions. On the upside, the first important resistance remains near 23650 followed by the broader 23750–23800 region where the 200 SMA continues acting as the major technical barrier. The next few sessions may therefore remain highly dependent on how the market reacts near these zones.
Buy On Dip And Breakout Opportunity
The current setup suggests that buy-on-dip interest may emerge near the 23500 support area if the market stabilizes with stronger candles and reduced selling pressure. Since this zone is closely aligned with short-term moving averages, traders may monitor whether buyers defend the region again during intraday weakness.
A stronger bullish continuation setup may develop only if Nifty sustains above the 23650 resistance zone with improving momentum. A successful breakout above this area could strengthen short-term sentiment and gradually improve the possibility of a move toward the broader 23750–23800 region. The overall structure currently favors cautious trading rather than aggressive directional positioning.
Nifty Target For Next Week
Nifty target for next week may largely depend on whether the market can sustain above short-term moving averages during the upcoming sessions. If momentum improves above resistance zones, the broader recovery structure may strengthen gradually. However, continued rejection near higher levels may keep the market inside a volatile consolidation range. The latest structure still reflects recovery attempts from lower levels, but stronger confirmation is required before a broader bullish continuation can develop.
Technical analysis works on probability and not certainty. Global developments, institutional activity, market sentiment and volatility can influence Nifty movement at any time.
Bottom Line
The current market structure suggests that Nifty is attempting to stabilize after recent weakness, although resistance pressure near higher moving averages continues limiting upside momentum. The broader structure has improved compared to the earlier correction phase, but traders may still watch support and resistance zones carefully before expecting stronger directional movement.
Frequently Asked Questions
What is the important resistance zone for Nifty tomorrow?
The immediate resistance area remains near 23650 followed by the broader 23750–23800 zone where the 200 SMA is currently positioned.
What are the major support levels for Nifty?
The important support region is currently visible near 23500 followed by lower support near 23350.
Why is Nifty struggling near moving averages?
The market is facing resistance because traders are still cautious near higher levels after the recent correction phase.
Can Nifty recover strongly next week?
The recovery structure may improve if the index sustains above short-term moving averages and successfully breaks higher resistance zones.
What does the current chart structure indicate?
The latest setup reflects a market transitioning from weakness toward consolidation, but stronger bullish confirmation is still pending.